Custom Metrics Autoscaling
Porter supports autoscaling based on custom Prometheus metrics, allowing you to scale your services based on application-specific signals like queue length, request latency, or business metrics. For other autoscaling options, see the Autoscaling overview.Configuring Metrics Scraping
Note: Metrics scraping is only available for web services. You can configure Porter to scrape metrics from your application’s/metrics endpoint. This is useful for:
- Collecting application-specific metrics
- Setting up custom autoscaling based on your metrics
- Monitoring application performance
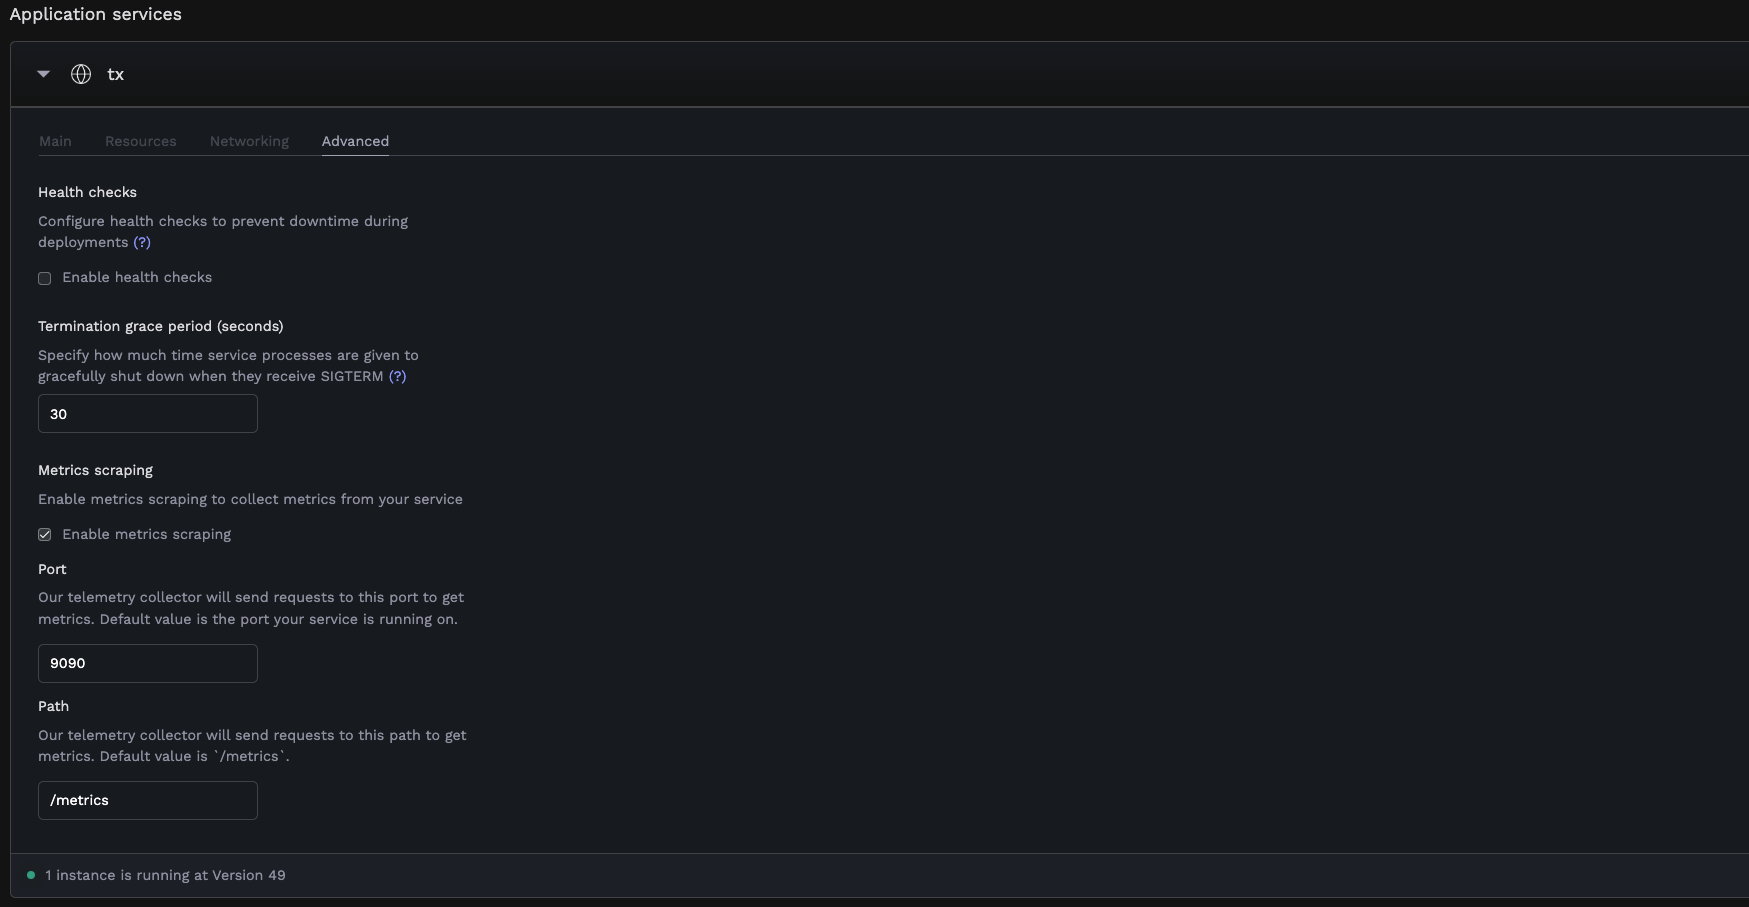
How to Enable Metrics Scraping
- Navigate to your application dashboard
- Select your web service
- Go to the Advanced tab under service settings
- Find the Metrics scraping section
- Enable Enable metrics scraping
- Configure the following options:
- Port: The port where your metrics endpoint is exposed (defaults to your web service’s default port)
- Path: The path where metrics are exposed (defaults to
/metrics)
Prometheus Metrics Format
Your application must expose metrics in Prometheus format:- Metrics are exposed as HTTP endpoints (typically
/metrics) - Each metric follows the format:
metric_name{label1="value1",label2="value2"} value - Common metric types:
- Counter: Values that only increase (e.g.,
http_requests_total) - Gauge: Values that can go up and down (e.g.,
queue_length) - Histogram: Observations distributed into buckets (e.g.,
request_duration_seconds)
- Counter: Values that only increase (e.g.,
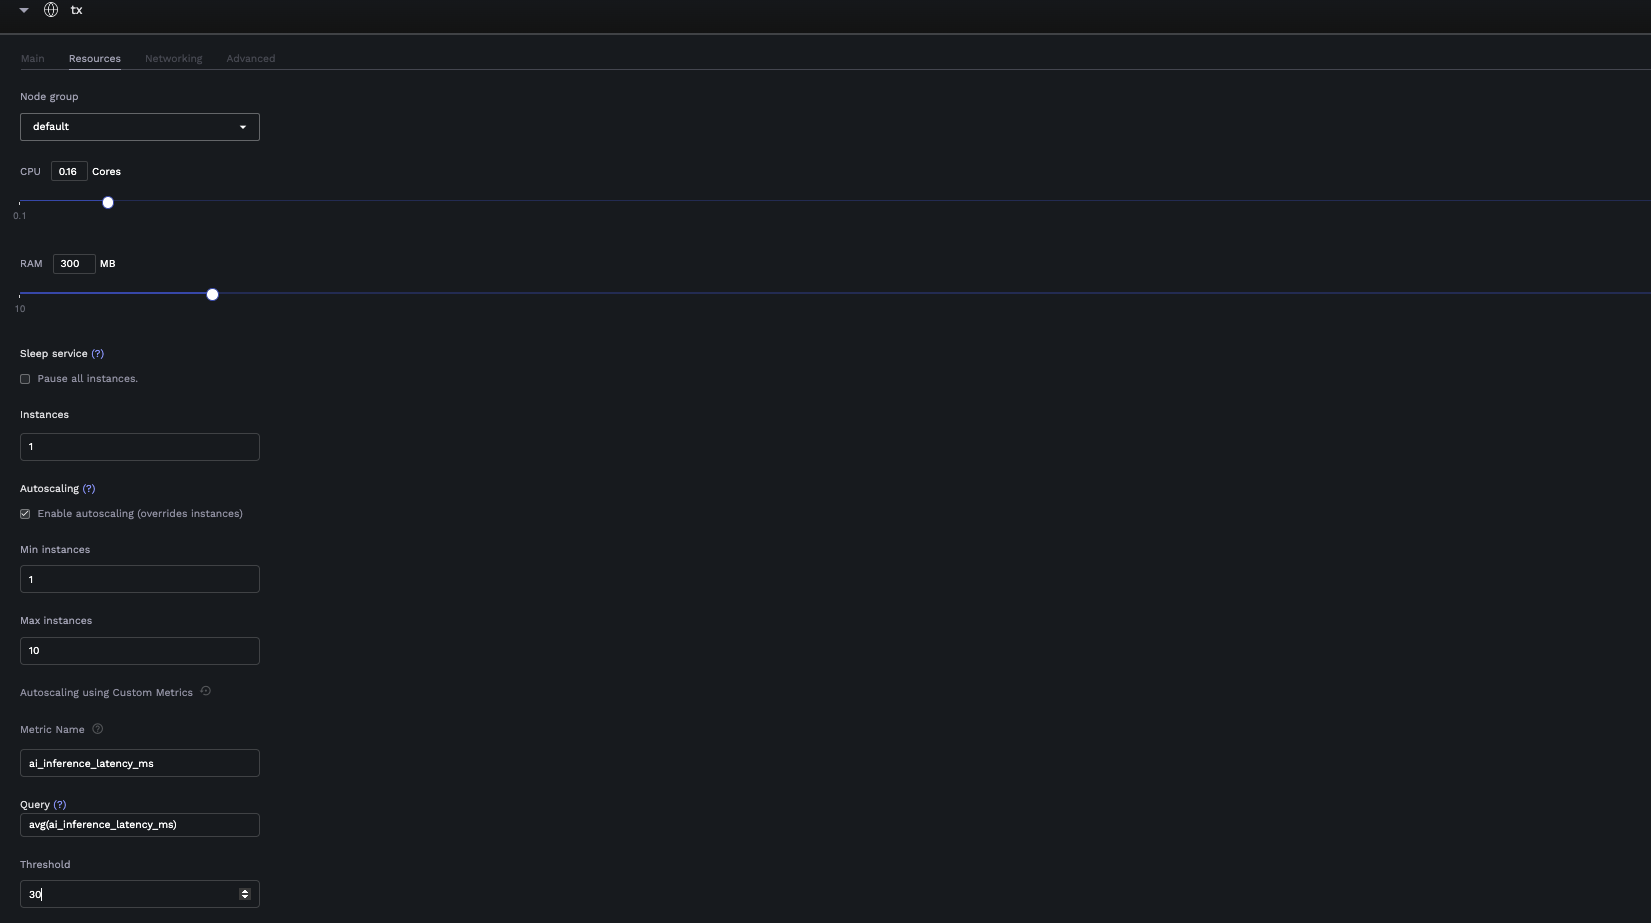
Configuring Custom Autoscaling
With metrics scraping enabled, you can set up autoscaling based on your custom metrics.How to Configure
- Navigate to your application dashboard
- Select your service
- Go to the Resources tab
- Configure basic autoscaling:
- Enable Autoscaling
- Set Min instances (e.g., 1)
- Set Max instances (e.g., 10)
- Switch to custom metrics mode by clicking the customize icon
- Configure custom metrics:
- Metric Name: Select a metric from your exposed Prometheus metrics
- Query: Write or modify the PromQL query (defaults to
avg(<metric_name>)) - Threshold: Set the threshold value that triggers scaling
Query Requirements
Your PromQL query must return a single numeric value (scalar). Valid query examples:avg(metric_name)→ Returns a single average valuesum(rate(http_requests_total[5m]))→ Returns a single sum valuemax(queue_length)→ Returns a single maximum value
- Vector results (multiple time series)
- String results
- No data/empty results
avg(), sum(), or max() to reduce it to a single value.
Switching Between Autoscaling Modes
You can switch between:- Default Mode: Autoscale based on CPU/Memory usage
- Custom Mode: Autoscale based on your application metrics
Example: Message Queue Consumer
Consider a data processing pipeline with a web API and worker service:Analytics Ingestion API
A web service that ingests events and publishes them to RabbitMQ for processing.Event Processing Worker
A worker service that processes events from RabbitMQ. Custom Autoscaling Configuration:- Metric Name:
rabbitmq_queue_messages{queue_name="user_events"} - Query:
sum(rabbitmq_queue_messages{queue_name="user_events"}) - Threshold:
1000(scale up when more than 1000 events are waiting)