For configuration-as-code (porter.yaml) autoscaling settings, see Autoscaling Configuration.
Autoscaling Options
| Method | Best For | Trigger |
|---|---|---|
| CPU/Memory | General workloads | Resource utilization thresholds |
| Custom Metrics | Queue processors, API rate limiting | Prometheus metrics |
| Temporal | Temporal workflow workers | Task queue depth |
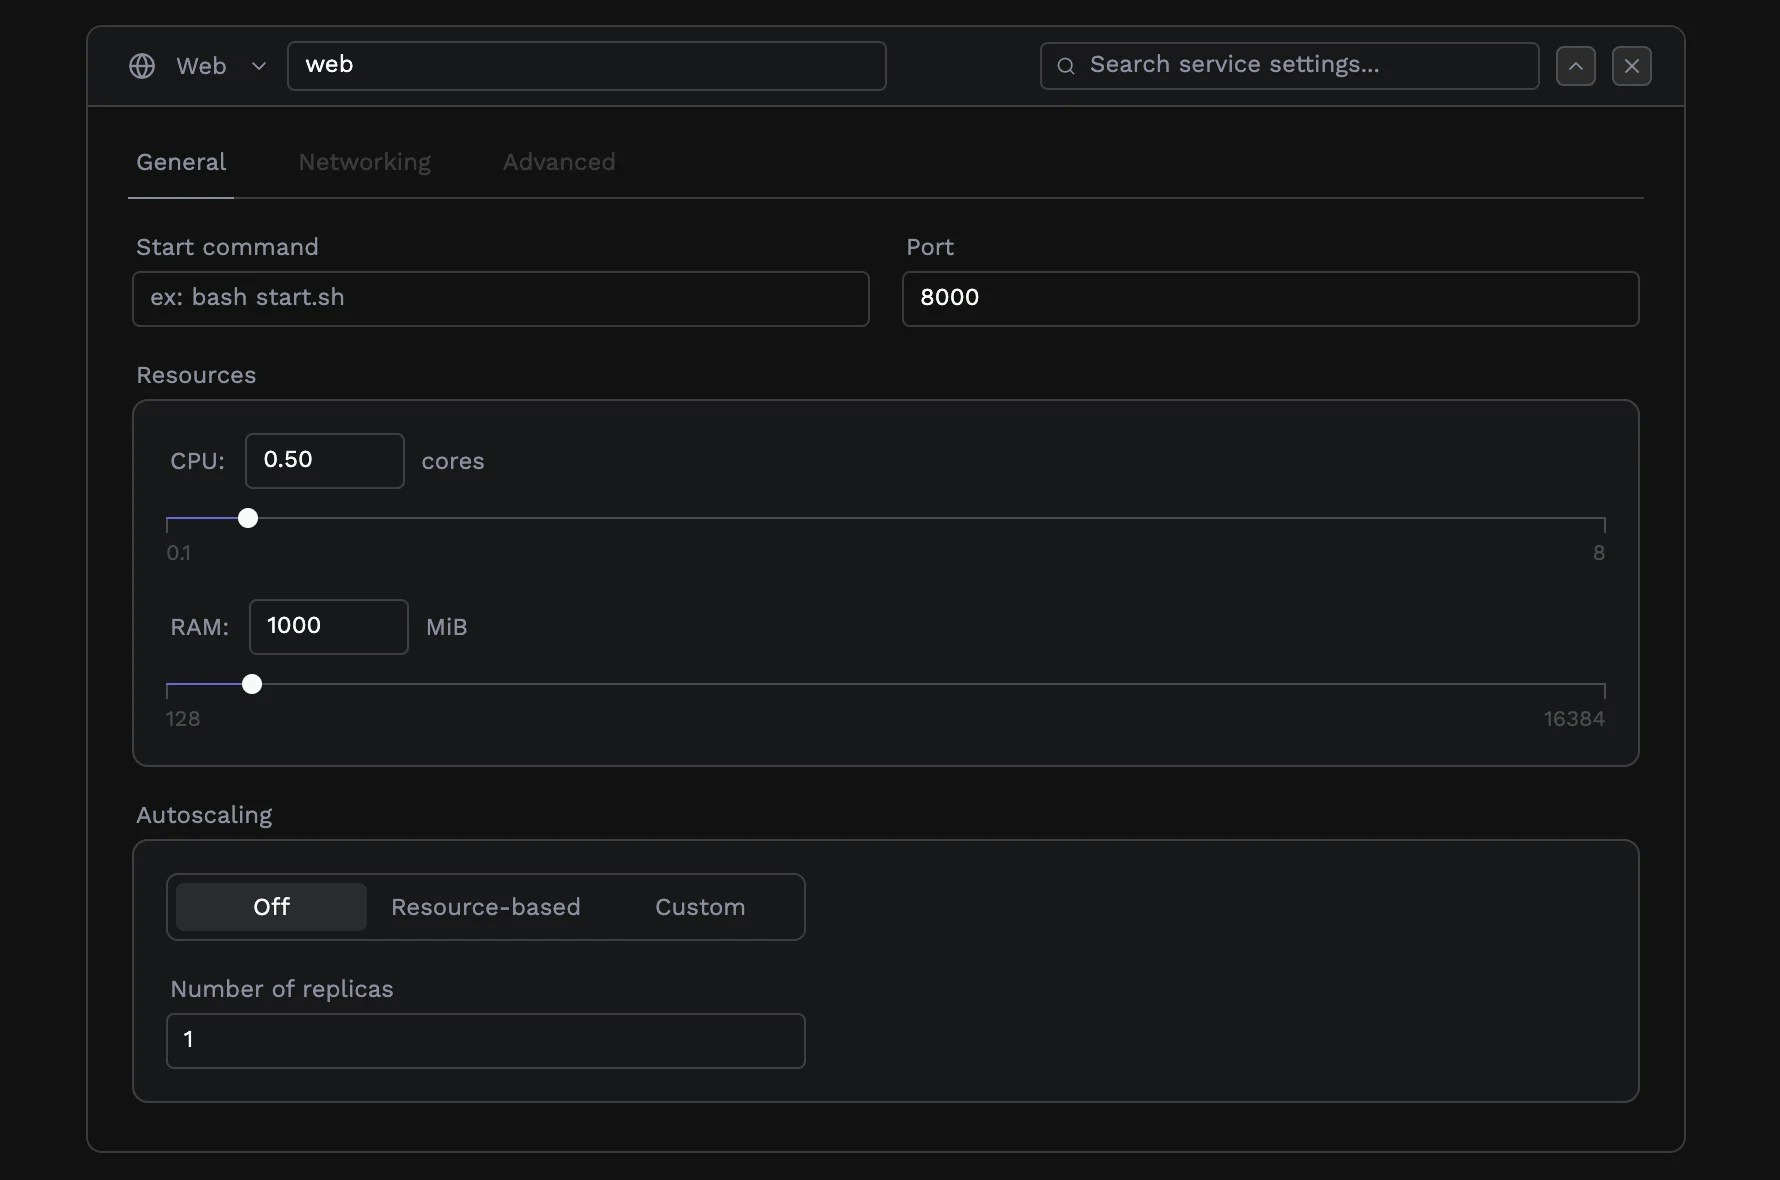
Standard Autoscaling (CPU/Memory)
The default autoscaling method scales your service based on CPU and memory utilization.Configuration
- Navigate to your application dashboard
- Select your service
- Go to the Resources tab
- Enable Autoscaling
- Configure the settings:
- Min instances: Minimum number of replicas (e.g., 1)
- Max instances: Maximum number of replicas (e.g., 10)
- CPU threshold: Target CPU utilization percentage (e.g., 70%)
- Memory threshold: Target memory utilization percentage (e.g., 70%)
How It Works
When either CPU or memory usage exceeds your configured threshold, Porter automatically adds replicas. When usage drops, replicas are removed (down to your minimum). For example, with a 70% CPU threshold:- If average CPU across pods exceeds 70%, new replicas are added
- If average CPU drops below 70%, excess replicas are removed
- The system maintains ~30% headroom for traffic spikes
Advanced Autoscaling
For workloads that need to scale based on external signals rather than resource usage, Porter offers advanced autoscaling options:Custom Metrics (Prometheus)
Scale based on application-specific metrics like queue length, request latency, or custom business metrics. Use cases:- Message queue consumers (RabbitMQ, Redis, SQS)
- Rate-limited API services
- Batch processing workers
Temporal Autoscaling
Scale Temporal workflow workers based on task queue depth. Porter monitors your Temporal task queues and automatically adjusts worker count. Use cases:- Temporal workflow workers
- Activity workers with variable load
- Event-driven processing pipelines