The DevOps Agent is currently in alpha. Features and behavior may change as we iterate on feedback. Responses are AI-generated and may not always be accurate. If you’re unsure about a recommendation, reach out to support.
Setup
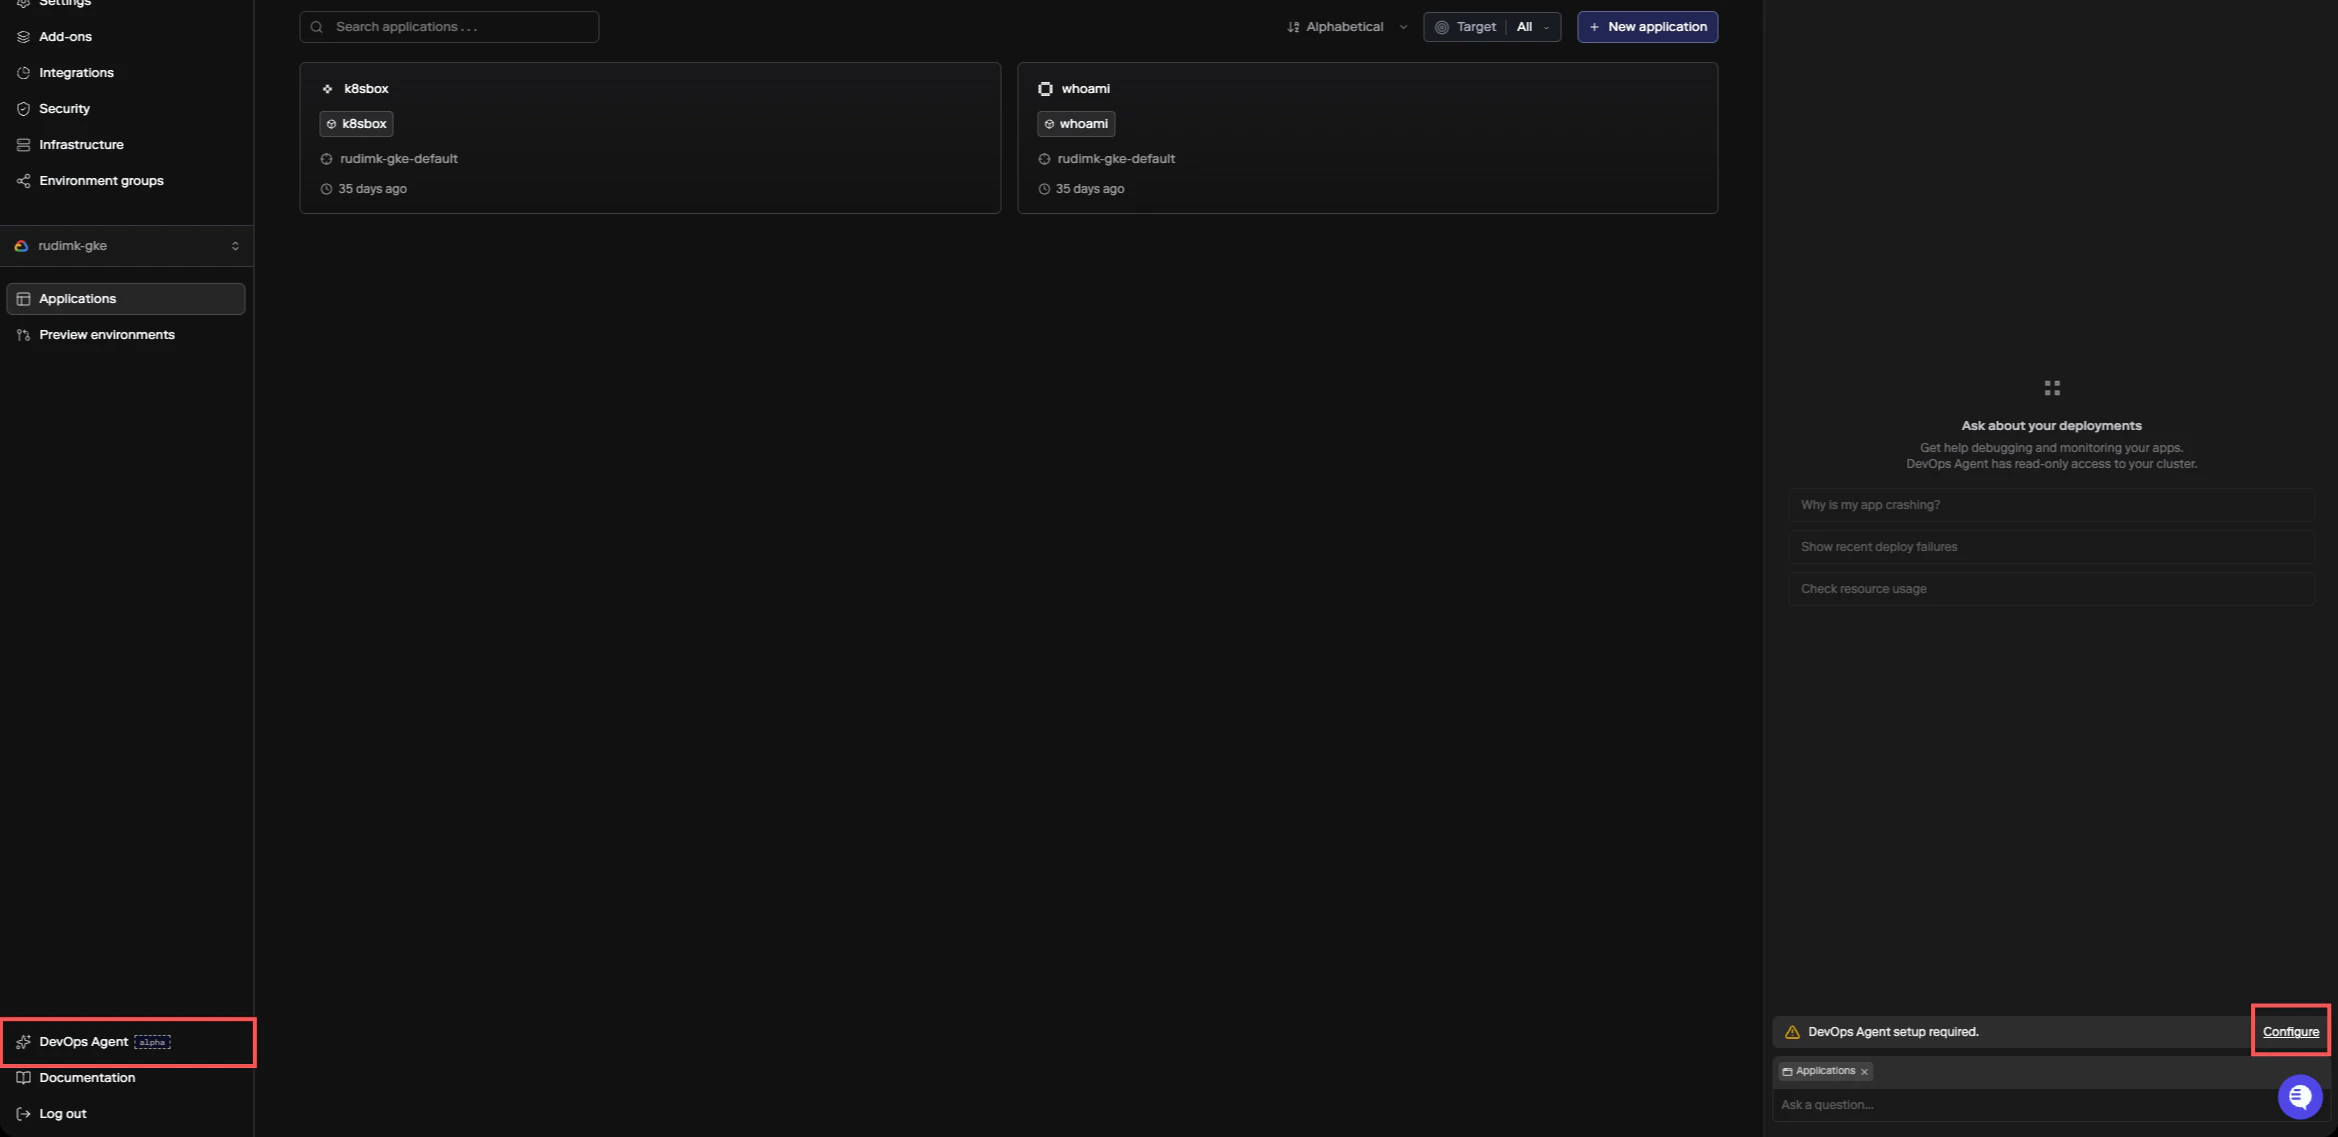
To enable the DevOps Agent, click DevOps Agent in the sidebar or press⌘+I. If the agent hasn’t been configured yet, you’ll see a setup prompt. Click Configure to open the settings panel.
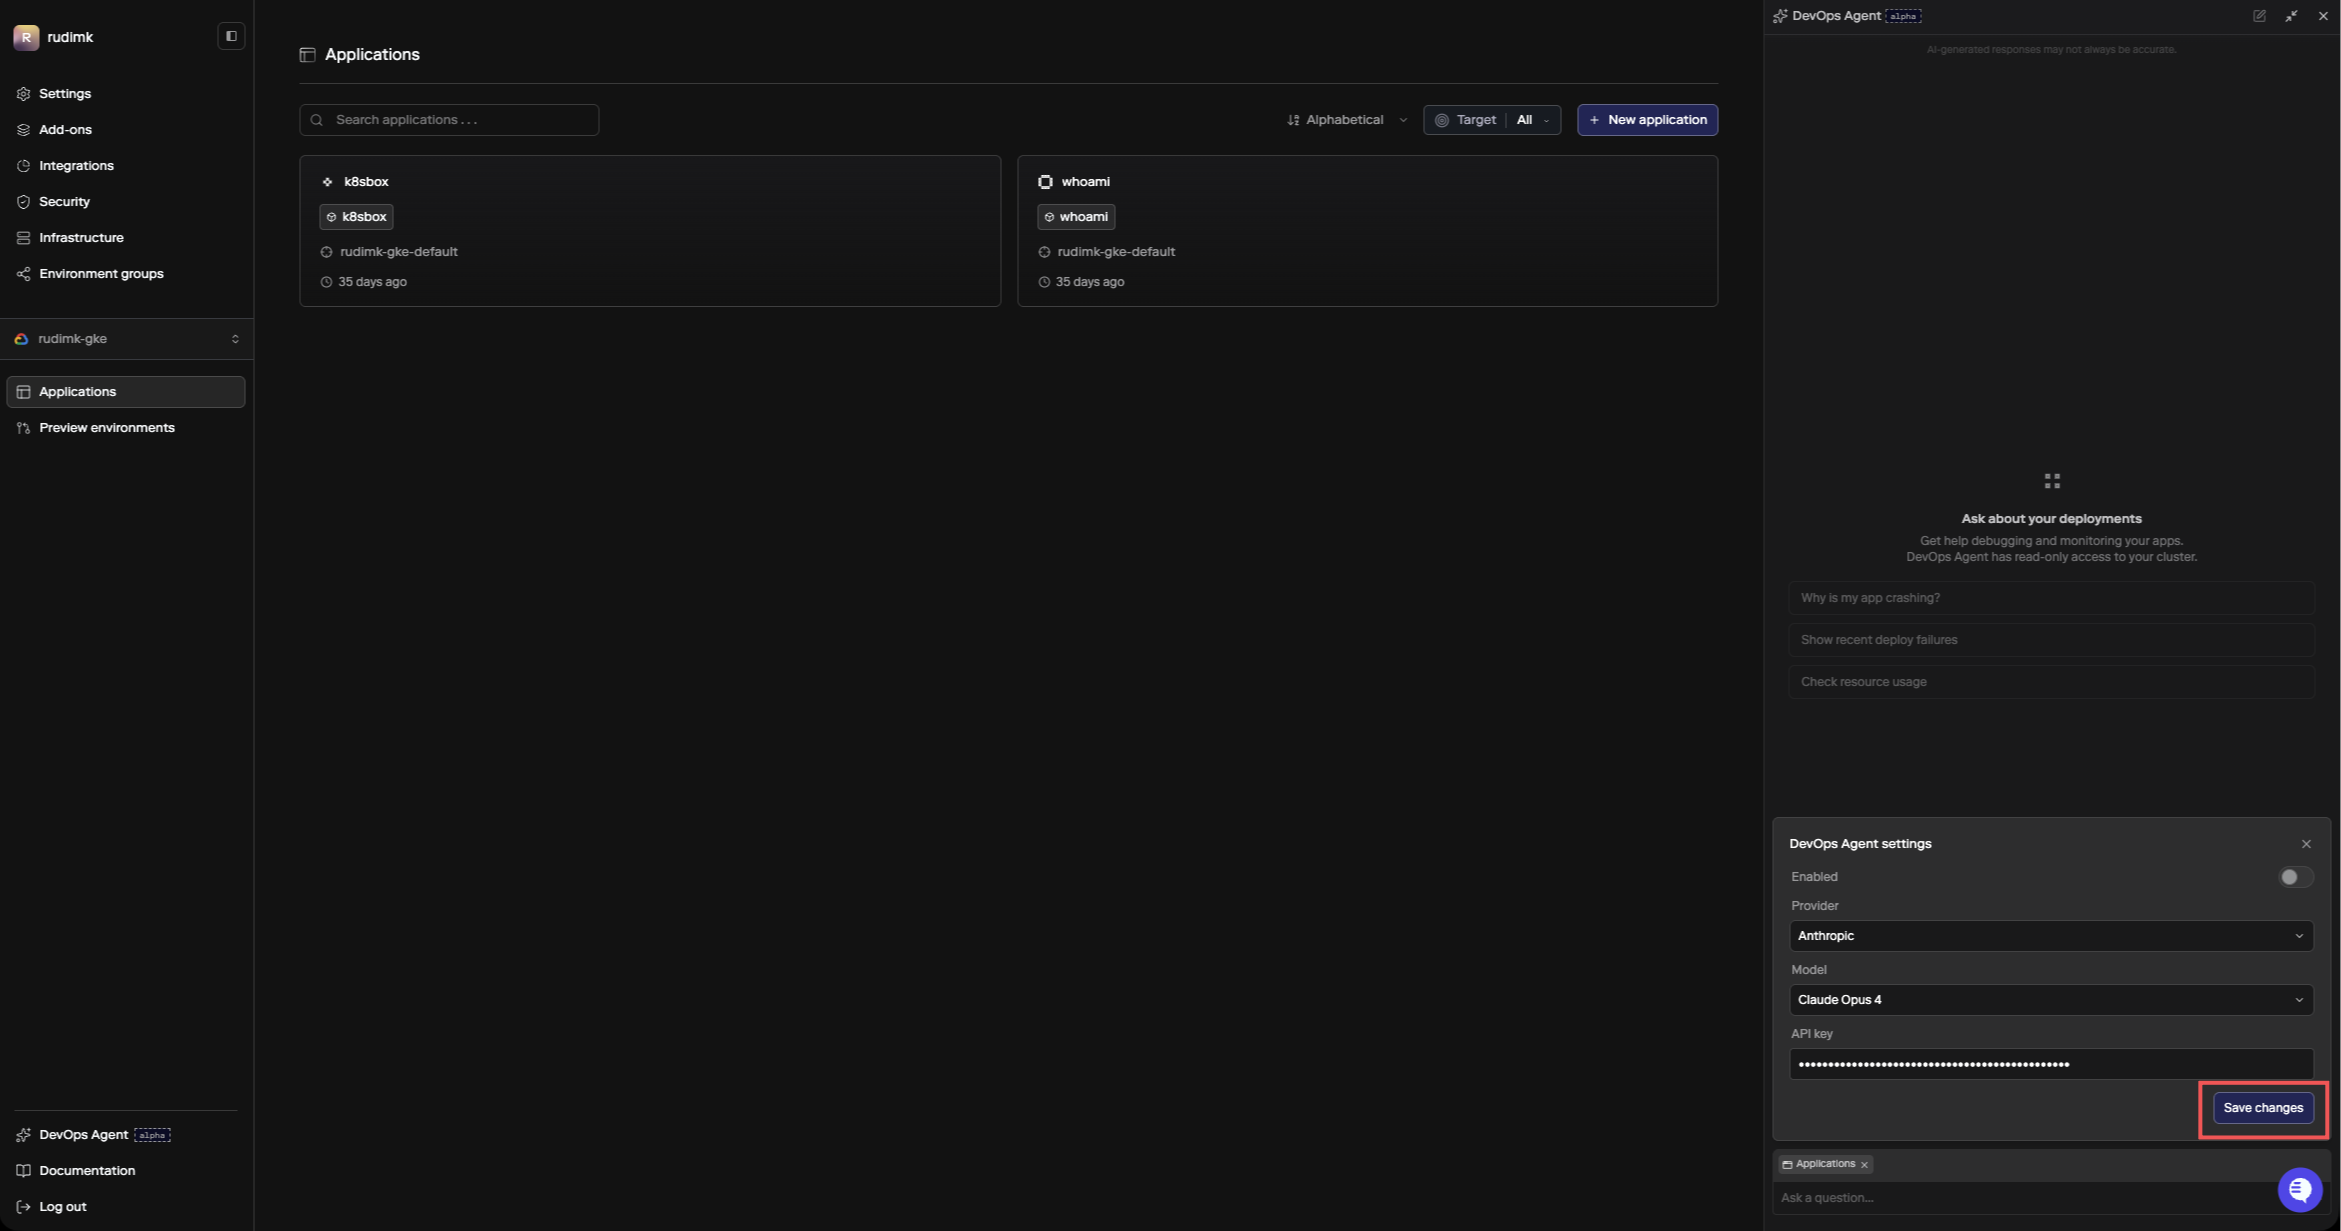
- Provider - either Anthropic (direct API) or AWS Bedrock
- Model - which model to run (Claude Sonnet 4.6, Claude Opus 4.6, or Claude Haiku 4.5)
- API key - your API key for the selected provider
- Provider URL (Bedrock only) - your Bedrock runtime endpoint, formatted as
https://bedrock-runtime.{region}.amazonaws.com(see AWS Bedrock endpoints for available regions)
How It Works
The agent runs inside your cluster and has read-only access to inspect the infrastructure backing your apps, add-ons, and datastores. When you ask a question, it pulls together information from multiple sources to build a diagnosis:- Porter API - deployment history, revision status, service configuration, build info
- Live cluster state - service logs, resource usage, events, scheduling status
- Porter docs and knowledge base - troubleshooting guides and configuration references
Using the Agent
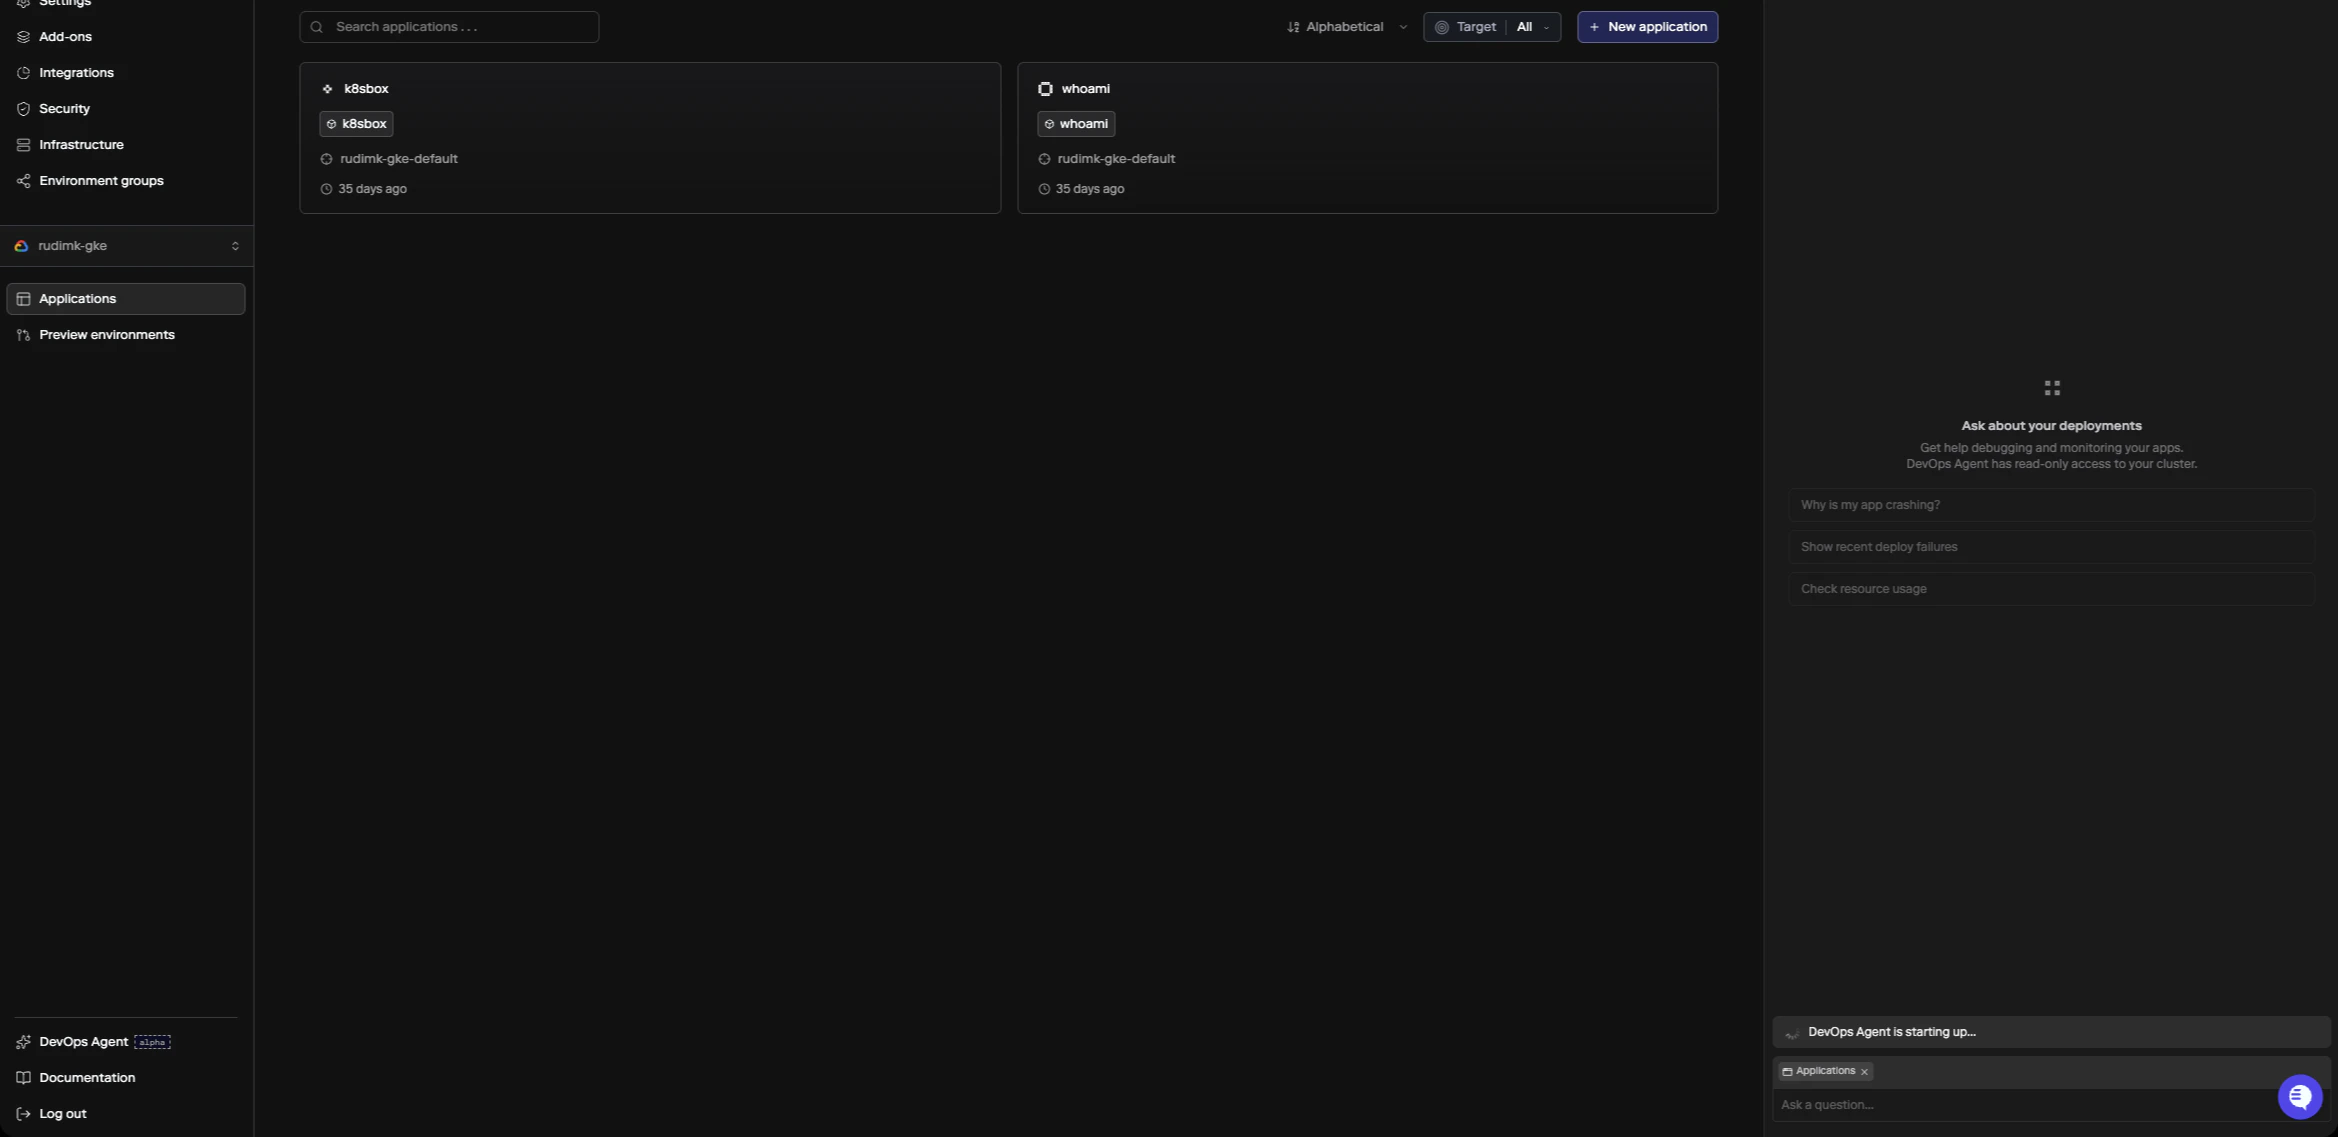
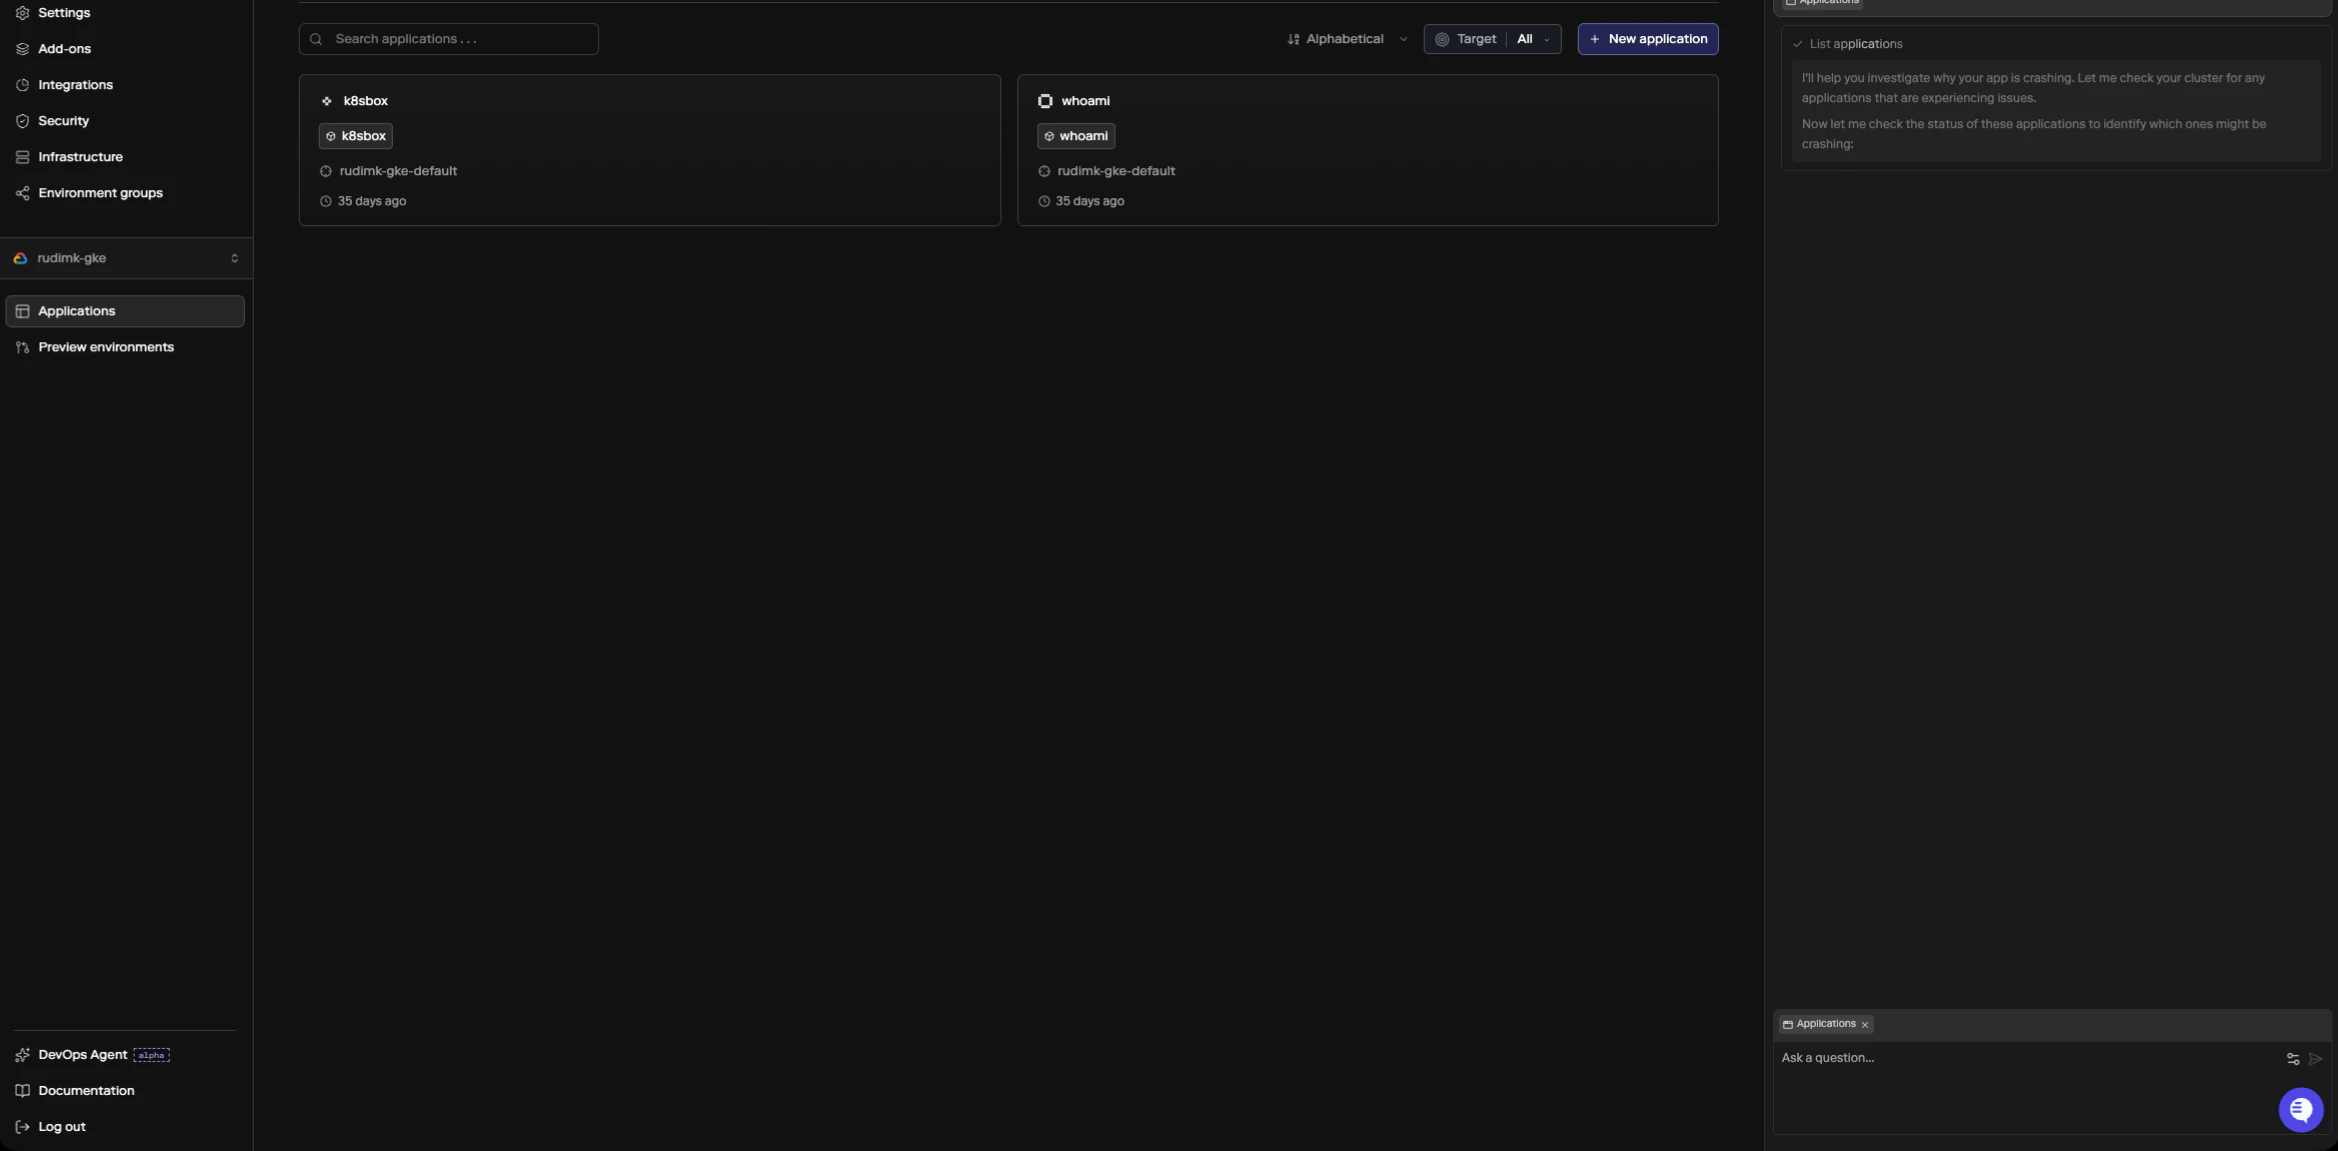
Open the DevOps Agent with⌘+I (or Ctrl+I on Windows/Linux), or click the agent icon in the sidebar. It’s available on any app, add-on, datastore, or cluster page. Ask your question in the input field and the agent will start investigating.
As it works, you can see what it’s checking in a collapsible thinking section.
Stopping a response
If you want to stop the agent while it’s responding, click the stop button that appears in place of the send button, or pressEscape while the input field is focused. The agent will stop its current response and keep everything it has generated so far, including any thinking steps. Your session stays active, so you can send a new message or follow-up question right away without starting over.
If you send a message while the agent is still responding, it gets queued and will be delivered automatically after the current response finishes or is stopped.
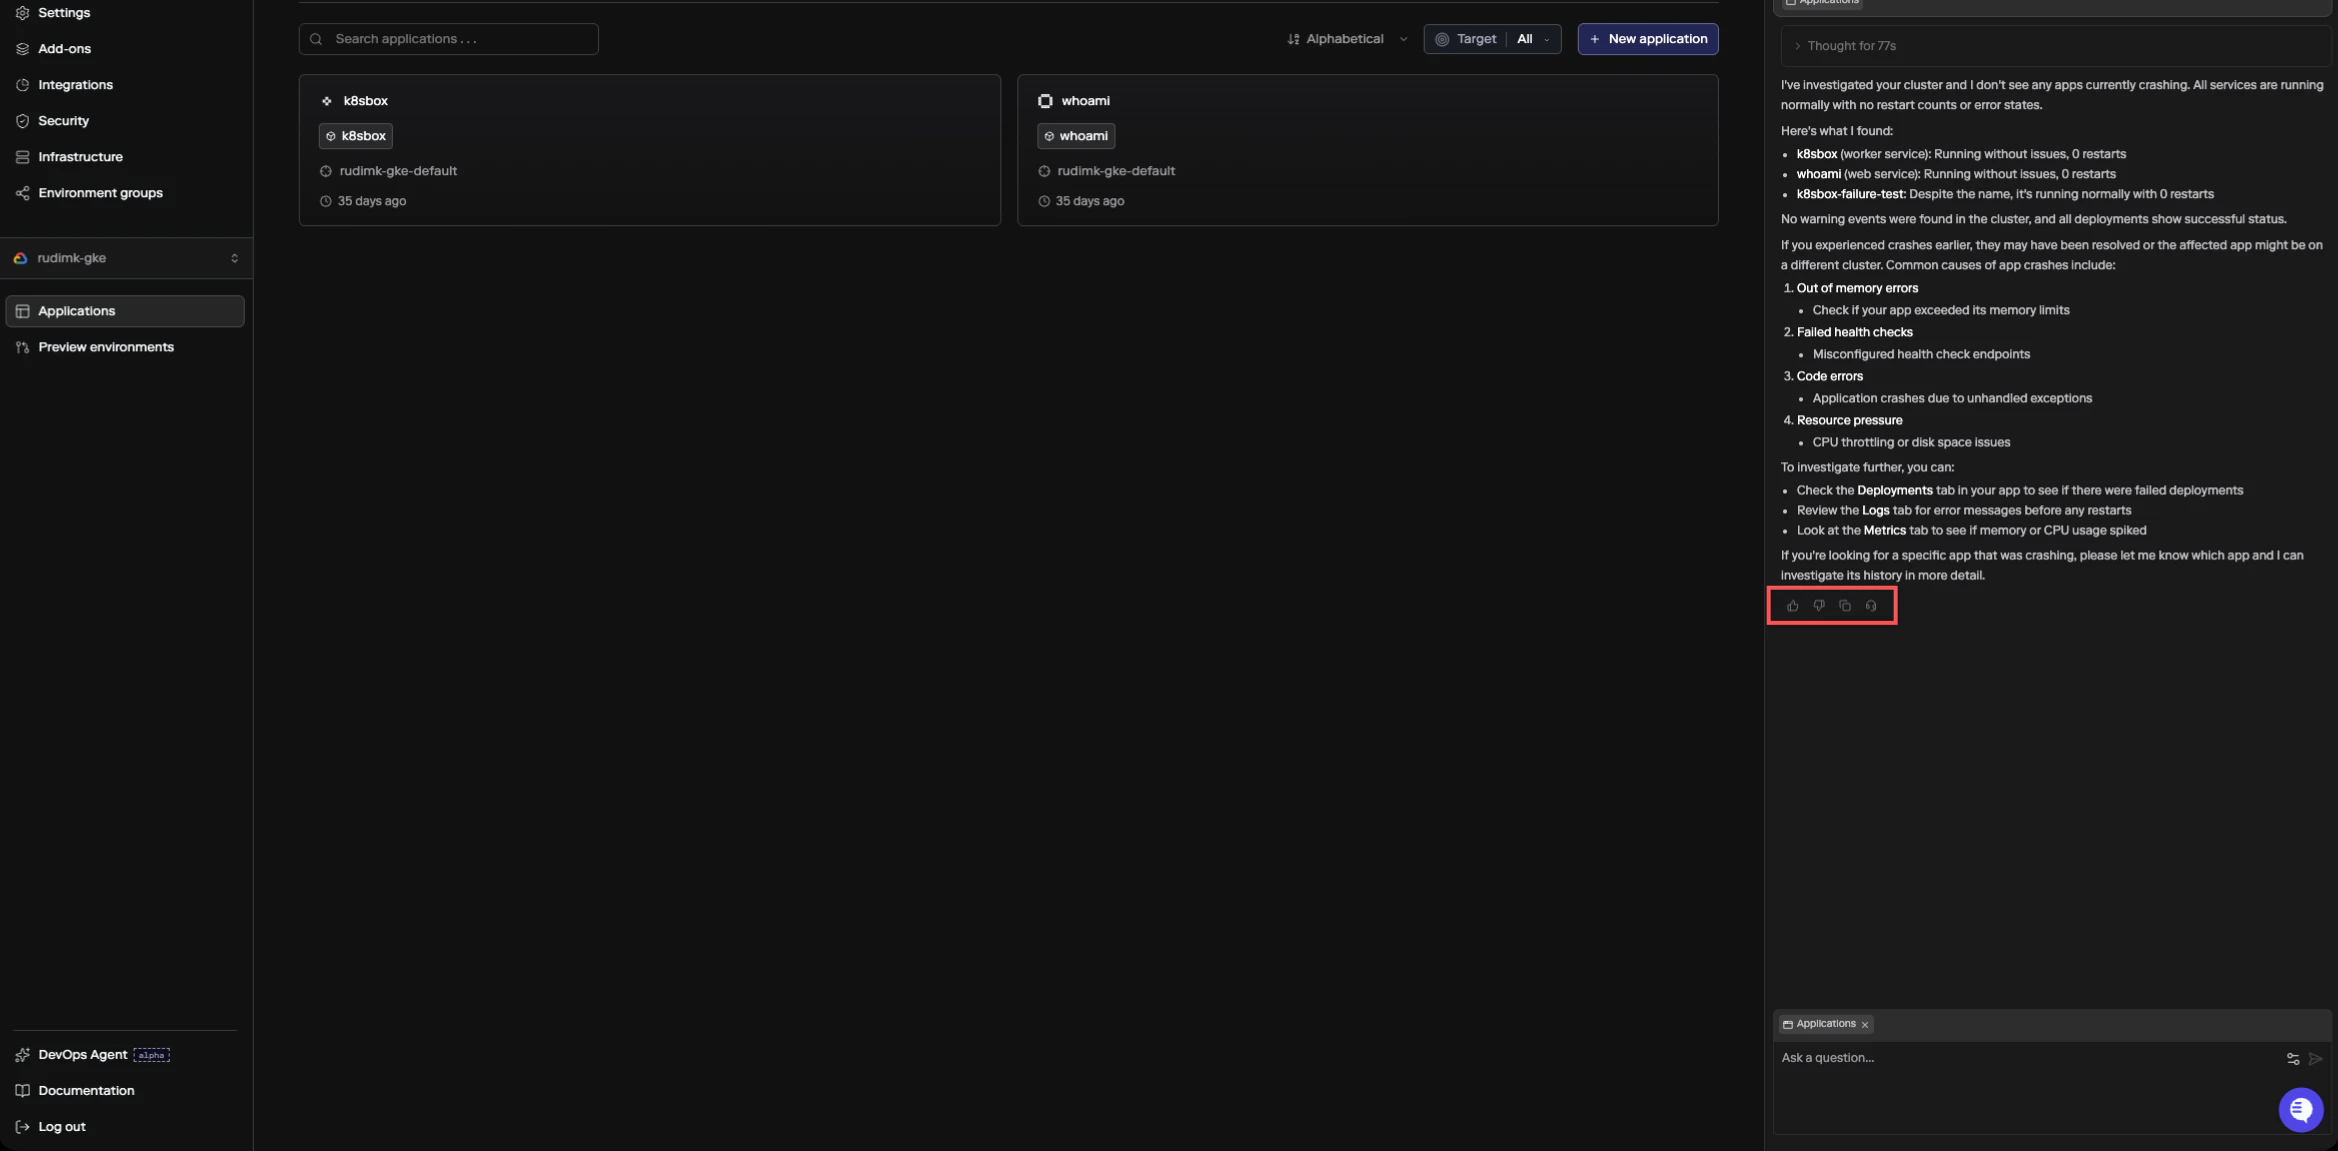
After the agent responds, you can rate the answer with thumbs up or thumbs down. If the answer wasn’t helpful, you’ll be prompted to select a reason (inaccurate, not helpful, or too verbose). You can also create a support ticket directly from any agent response by clicking the headset icon, which is useful if the agent’s diagnosis points to something that needs human help.
What You Can Ask About
The agent is good at diagnosing runtime issues with your apps and infrastructure. Some common questions:- Why is my service restarting?
- Why did this deployment fail?
- What’s using all the memory on my cluster?
- Why can’t my app connect to the database?
- How do I set up autoscaling for this service?
- Why is my build failing?
Limitations
The agent has read-only access. It can inspect your infrastructure and tell you what’s wrong, but it can’t make changes on your behalf. Any fixes it recommends will point you to the right place in the dashboard, CLI, orporter.yaml to make the change yourself.
The agent is scoped to the resource you’re viewing. If you need help with a different app or cluster, navigate to that resource’s page and start a new session.