> ## Documentation Index
> Fetch the complete documentation index at: https://docs.porter.run/llms.txt
> Use this file to discover all available pages before exploring further.
# Custom metrics autoscaling
> Scale your web services based on custom Prometheus metrics by configuring metrics scraping endpoints and KEDA-powered autoscaling rules
# Custom Metrics Autoscaling
Porter supports autoscaling based on custom Prometheus metrics, allowing you to scale your services based on application-specific signals like queue length, request latency, or business metrics.
For other autoscaling options, see the [Autoscaling overview](/applications/configure/autoscaling).
## Configuring Metrics Scraping
**Note:** Metrics scraping is only available for web services.
You can configure Porter to scrape metrics from your application's `/metrics` endpoint. This is useful for:
* Collecting application-specific metrics
* Setting up custom autoscaling based on your metrics
* Monitoring application performance
### How to Enable Metrics Scraping
1. Navigate to your application dashboard
2. Select your web service
3. Go to the **Advanced** tab under service settings
4. Find the **Metrics scraping** section
5. Enable **Enable metrics scraping**
6. Configure the following options:
* **Port**: The port where your metrics endpoint is exposed (defaults to your web service's default port)
* **Path**: The path where metrics are exposed (defaults to `/metrics`)
**Important:** Our telemetry collector will automatically send requests to the specified port and path to collect metrics from your service.
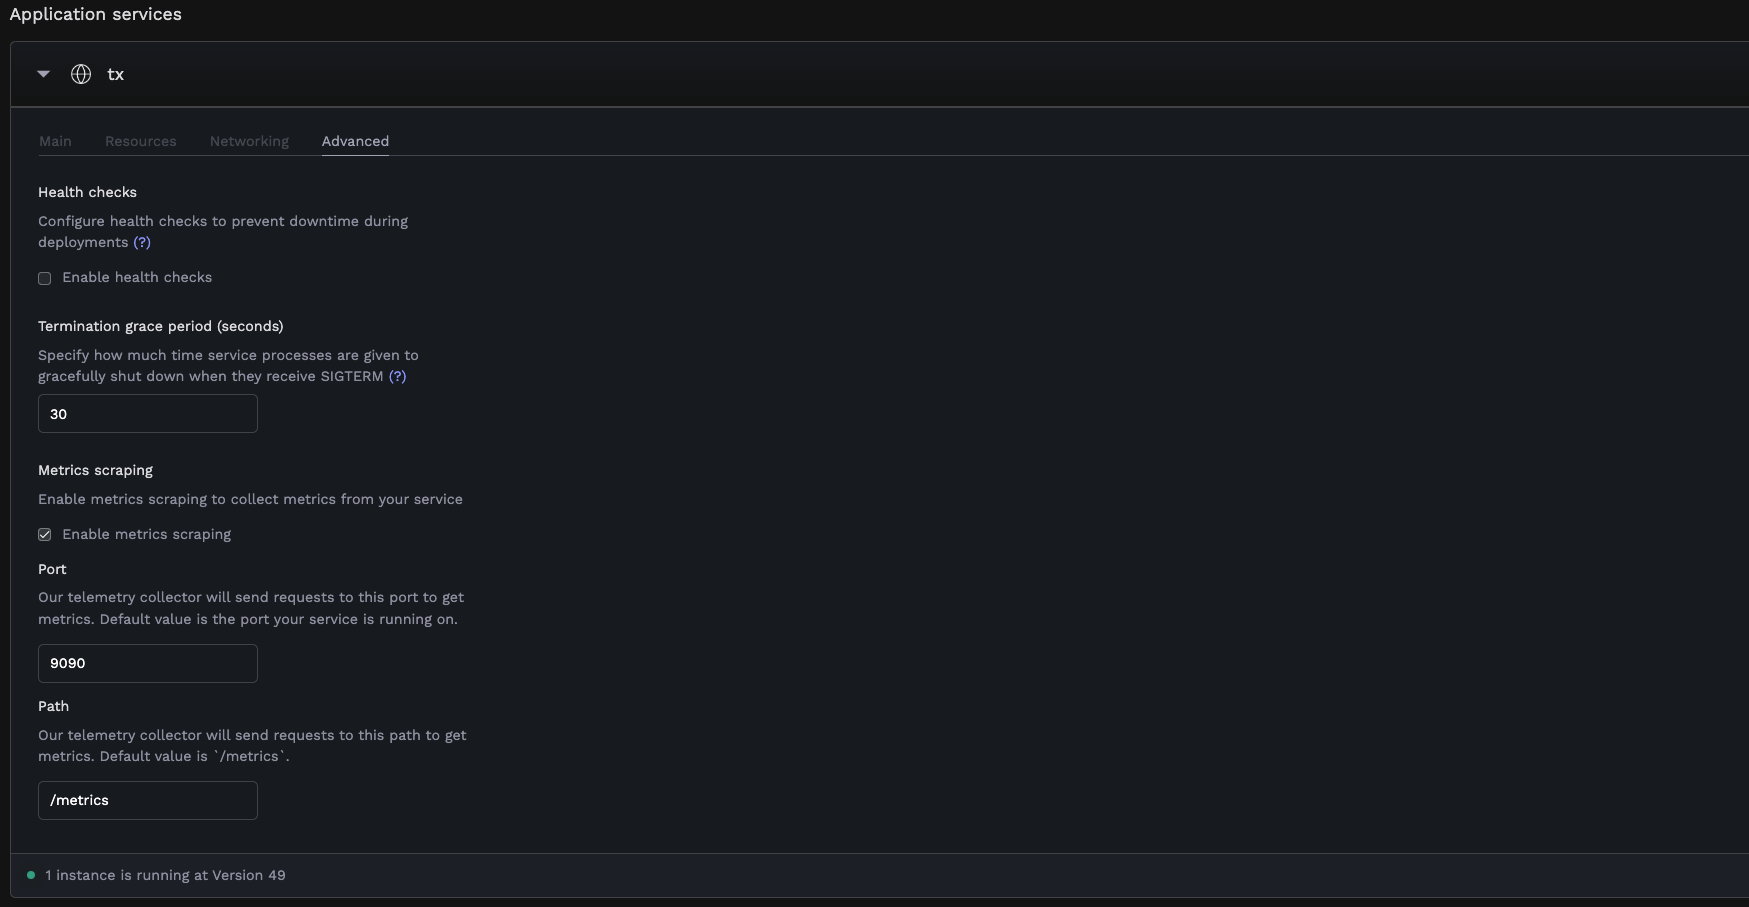 *Metrics scraping configuration in the Advanced tab of a web service*
### Prometheus Metrics Format
Your application must expose metrics in Prometheus format:
* Metrics are exposed as HTTP endpoints (typically `/metrics`)
* Each metric follows the format: `metric_name{label1="value1",label2="value2"} value`
* Common metric types:
* **Counter**: Values that only increase (e.g., `http_requests_total`)
* **Gauge**: Values that can go up and down (e.g., `queue_length`)
* **Histogram**: Observations distributed into buckets (e.g., `request_duration_seconds`)
Example metrics output:
```prometheus theme={null}
# HELP http_requests_total Total number of HTTP requests
# TYPE http_requests_total counter
http_requests_total{method="post",code="200"} 1027
http_requests_total{method="get",code="200"} 2048
```
For detailed information about implementing Prometheus metrics in your application, refer to:
* [Official Prometheus Exposition Format](https://prometheus.io/docs/instrumenting/exposition_formats/)
* [Client Libraries for Different Languages](https://prometheus.io/docs/instrumenting/clientlibs/)
## Configuring Custom Autoscaling
With metrics scraping enabled, you can set up autoscaling based on your custom metrics.
### How to Configure
1. Navigate to your application dashboard
2. Select your service
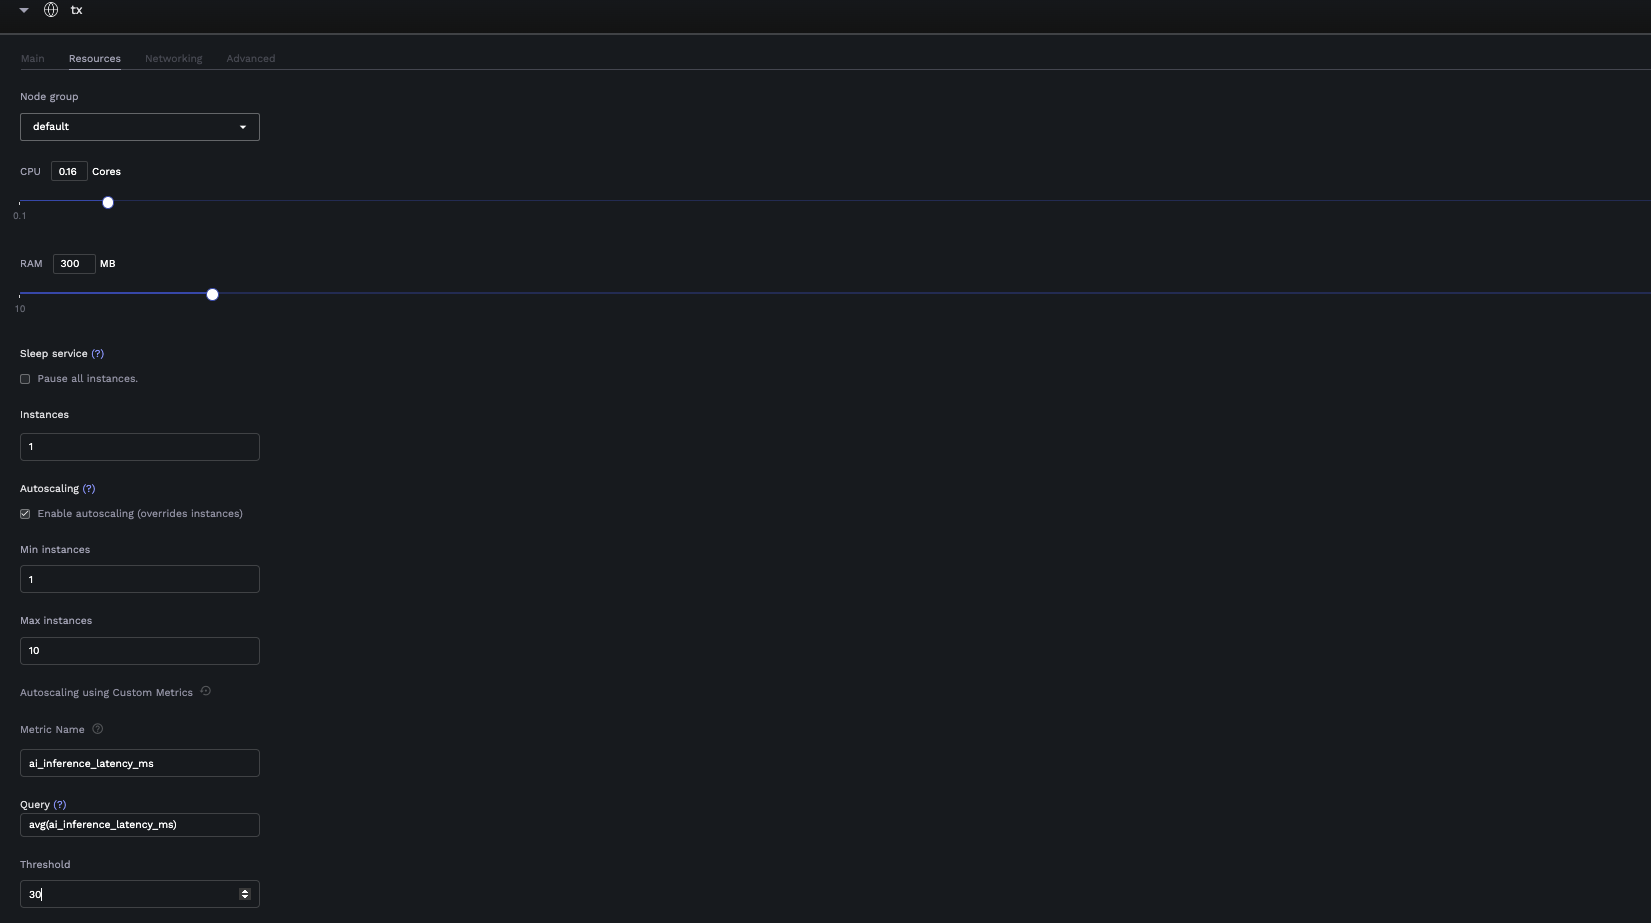
3. Go to the **Resources** tab
4. Configure basic autoscaling:
* Enable **Autoscaling**
* Set **Min instances** (e.g., 1)
* Set **Max instances** (e.g., 10)
5. Switch to custom metrics mode by clicking the customize icon
6. Configure custom metrics:
* **Metric Name**: Select a metric from your exposed Prometheus metrics
* **Query**: Write or modify the PromQL query (defaults to `avg()`)
* **Threshold**: Set the threshold value that triggers scaling
When your selected metric exceeds the threshold, Porter will automatically scale your service between the min and max instances you've specified.
*Metrics scraping configuration in the Advanced tab of a web service*
### Prometheus Metrics Format
Your application must expose metrics in Prometheus format:
* Metrics are exposed as HTTP endpoints (typically `/metrics`)
* Each metric follows the format: `metric_name{label1="value1",label2="value2"} value`
* Common metric types:
* **Counter**: Values that only increase (e.g., `http_requests_total`)
* **Gauge**: Values that can go up and down (e.g., `queue_length`)
* **Histogram**: Observations distributed into buckets (e.g., `request_duration_seconds`)
Example metrics output:
```prometheus theme={null}
# HELP http_requests_total Total number of HTTP requests
# TYPE http_requests_total counter
http_requests_total{method="post",code="200"} 1027
http_requests_total{method="get",code="200"} 2048
```
For detailed information about implementing Prometheus metrics in your application, refer to:
* [Official Prometheus Exposition Format](https://prometheus.io/docs/instrumenting/exposition_formats/)
* [Client Libraries for Different Languages](https://prometheus.io/docs/instrumenting/clientlibs/)
## Configuring Custom Autoscaling
With metrics scraping enabled, you can set up autoscaling based on your custom metrics.
### How to Configure
1. Navigate to your application dashboard
2. Select your service
3. Go to the **Resources** tab
4. Configure basic autoscaling:
* Enable **Autoscaling**
* Set **Min instances** (e.g., 1)
* Set **Max instances** (e.g., 10)
5. Switch to custom metrics mode by clicking the customize icon
6. Configure custom metrics:
* **Metric Name**: Select a metric from your exposed Prometheus metrics
* **Query**: Write or modify the PromQL query (defaults to `avg()`)
* **Threshold**: Set the threshold value that triggers scaling
When your selected metric exceeds the threshold, Porter will automatically scale your service between the min and max instances you've specified.
 *Custom autoscaling configuration in the Resources tab of a service*
### Query Requirements
Your PromQL query must return a single numeric value (scalar).
**Valid query examples:**
* `avg(metric_name)` → Returns a single average value
* `sum(rate(http_requests_total[5m]))` → Returns a single sum value
* `max(queue_length)` → Returns a single maximum value
**Invalid queries:**
* Vector results (multiple time series)
* String results
* No data/empty results
If your query returns multiple values, use aggregation operators like `avg()`, `sum()`, or `max()` to reduce it to a single value.
### Switching Between Autoscaling Modes
You can switch between:
* **Default Mode**: Autoscale based on CPU/Memory usage
* **Custom Mode**: Autoscale based on your application metrics
Click the customize/restore icons to switch between modes.
## Example: Message Queue Consumer
Consider a data processing pipeline with a web API and worker service:
### Analytics Ingestion API
A web service that ingests events and publishes them to RabbitMQ for processing.
```python theme={null}
from prometheus_client import generate_latest, Gauge
# Track messages in RabbitMQ queues
queue_metrics = Gauge('rabbitmq_queue_messages',
'Number of messages in queue',
['queue_name'])
@app.route('/metrics')
def metrics():
queue_metrics.labels(queue_name='user_events').set(
rabbit_connection.get_queue_length('user_events'))
queue_metrics.labels(queue_name='system_events').set(
rabbit_connection.get_queue_length('system_events'))
return generate_latest()
```
### Event Processing Worker
A worker service that processes events from RabbitMQ.
**Custom Autoscaling Configuration:**
* Metric Name: `rabbitmq_queue_messages{queue_name="user_events"}`
* Query: `sum(rabbitmq_queue_messages{queue_name="user_events"})`
* Threshold: `1000` (scale up when more than 1000 events are waiting)
With this setup, Porter will add more workers when the queue backs up and scale down when the queue is processed.
*Custom autoscaling configuration in the Resources tab of a service*
### Query Requirements
Your PromQL query must return a single numeric value (scalar).
**Valid query examples:**
* `avg(metric_name)` → Returns a single average value
* `sum(rate(http_requests_total[5m]))` → Returns a single sum value
* `max(queue_length)` → Returns a single maximum value
**Invalid queries:**
* Vector results (multiple time series)
* String results
* No data/empty results
If your query returns multiple values, use aggregation operators like `avg()`, `sum()`, or `max()` to reduce it to a single value.
### Switching Between Autoscaling Modes
You can switch between:
* **Default Mode**: Autoscale based on CPU/Memory usage
* **Custom Mode**: Autoscale based on your application metrics
Click the customize/restore icons to switch between modes.
## Example: Message Queue Consumer
Consider a data processing pipeline with a web API and worker service:
### Analytics Ingestion API
A web service that ingests events and publishes them to RabbitMQ for processing.
```python theme={null}
from prometheus_client import generate_latest, Gauge
# Track messages in RabbitMQ queues
queue_metrics = Gauge('rabbitmq_queue_messages',
'Number of messages in queue',
['queue_name'])
@app.route('/metrics')
def metrics():
queue_metrics.labels(queue_name='user_events').set(
rabbit_connection.get_queue_length('user_events'))
queue_metrics.labels(queue_name='system_events').set(
rabbit_connection.get_queue_length('system_events'))
return generate_latest()
```
### Event Processing Worker
A worker service that processes events from RabbitMQ.
**Custom Autoscaling Configuration:**
* Metric Name: `rabbitmq_queue_messages{queue_name="user_events"}`
* Query: `sum(rabbitmq_queue_messages{queue_name="user_events"})`
* Threshold: `1000` (scale up when more than 1000 events are waiting)
With this setup, Porter will add more workers when the queue backs up and scale down when the queue is processed.